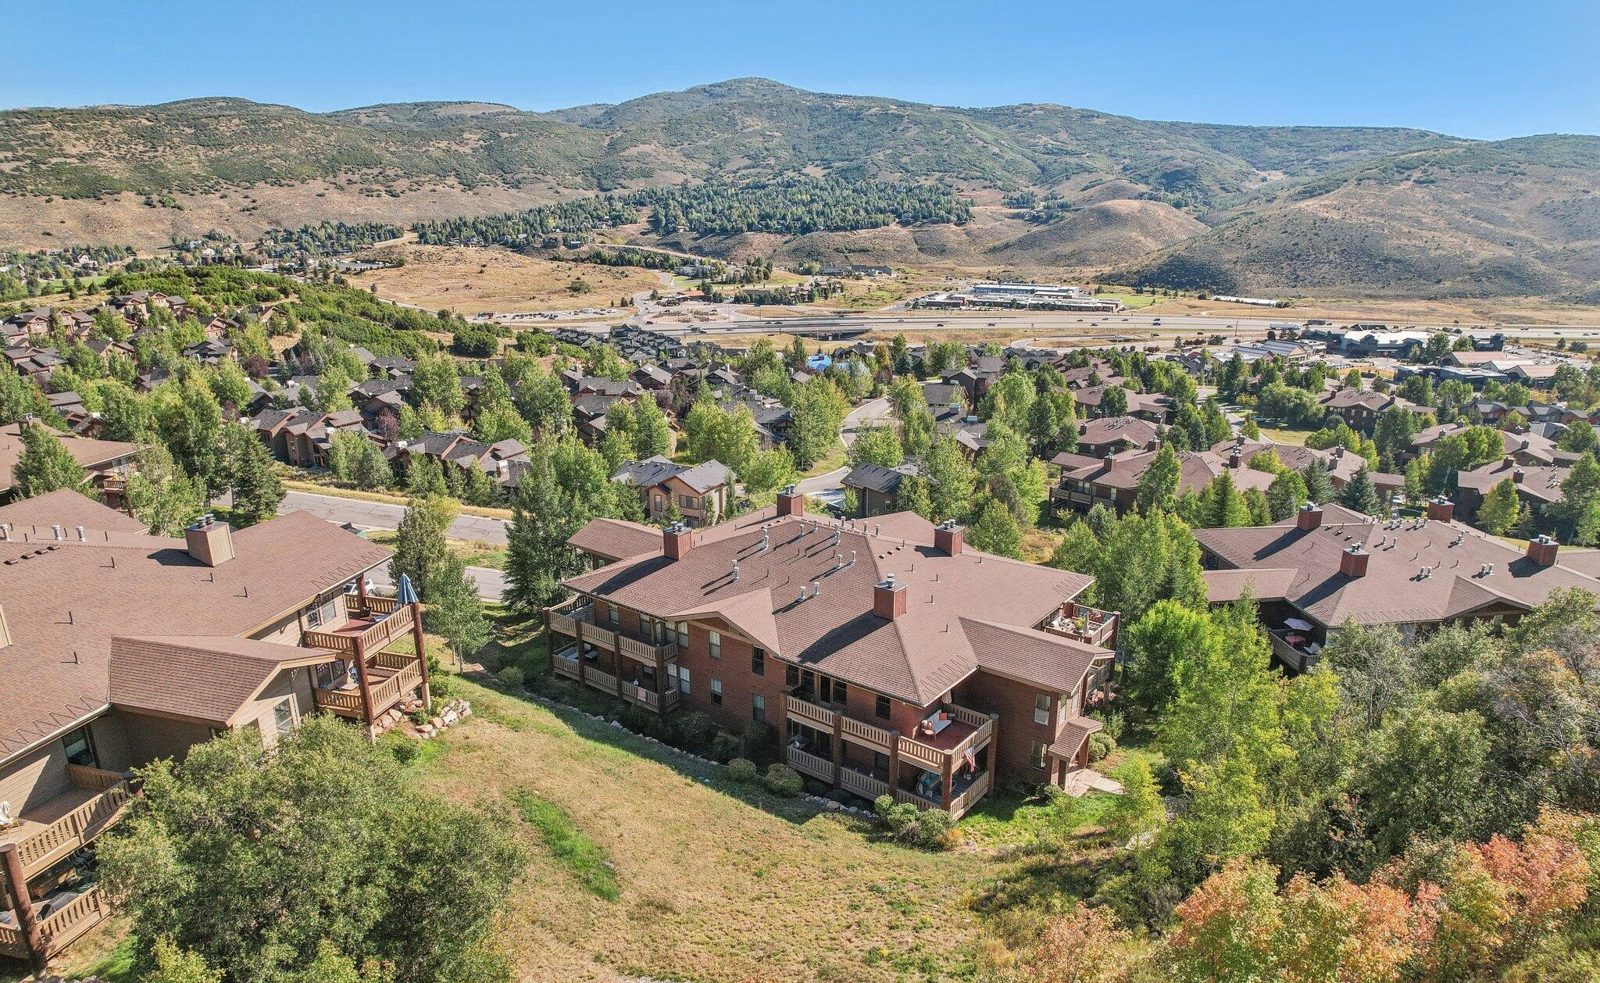

Only two homes closed in Kimball in October while ten new listings came to market, and just one home went under contract.
What happened in Kimball this October?
Two homes closed in Kimball during October 2026, down from six in October 2025. Total closed volume was $2.0 million, down 69.4 percent from $6.5 million.
The two sales were very different: a $1,450,000 detached home in Blackhawk Station and a $537,000 condominium at Canyon Creek. The median and average sale price were both $993,500, down 10.9 percent and 8.2 percent from $1,115,000 and $1,082,500 a year earlier.
Those comparisons come with a caution. Last October’s six sales included four at $1,000,000 or more, so the mix of homes that sold is a large part of the difference.
Buyers got closer to asking price than last year. The two homes closed at an average of 93.2 percent of original list price, up from 89.7 percent. With two sales, average cumulative days on market was 69 days, compared with 124 days a year earlier.
The larger story was on the supply side. Ten new listings came to market, up 66.7 percent from six, while only one home went under contract, down from seven. There were 40 homes available in mid-October against 36 a year earlier.
Ratio
(Mid-Month)
With only two closings, the average and median sale price are the same, and so are the average and median CDOM.
CDOM is cumulative days on market, which counts the full time a property has been listed across listing periods rather than the days until it went under contract.
Absorption rate estimates how many months it would take to sell the listed supply at the current pace of sales. It is based on the mid-month supply count and is sensitive to small changes in sales.
How did the Kimball market change over the last three months?
Closings slowed through the quarter, from seven in August to six in September and two in October. Over the three months, 15 homes closed, the same as in the same stretch of 2025, but the pace was falling at the end.
August 2026
September 2026
October 2026
| Metric | Aug 2026 | Sep 2026 | Oct 2026 |
|---|---|---|---|
| Closed sales | 7 | 6 | 2 |
| Median sale price | $860,000 | $502,000 | $993,500 |
| Average sale price | $959,714 | $618,250 | $993,500 |
| Closed sale volume | $6,718,000 | $3,709,500 | $1,987,000 |
| New listings | 11 | 10 | 10 |
| Pending listings | 6 | 2 | 1 |
| Sale-to-original-list-price ratio | 93.2% | 88.5% | 93.2% |
| Average CDOM | 47 days | 131 days | 69 days |
The same three months a year earlier:
| Metric | Aug 2025 | Sep 2025 | Oct 2025 |
|---|---|---|---|
| Closed sales | 7 | 2 | 6 |
| Median sale price | $750,000 | $755,000 | $1,115,000 |
| New listings | 10 | 9 | 6 |
| Pending listings | 5 | 5 | 7 |
Three patterns stand out. First, buyers committed more slowly. Pending listings fell from 6 in August to 2 in September and 1 in October, and totaled 9 over the quarter against 17 in 2025, which may mean fewer closings follow.
Second, sellers kept listing. Thirty-one new listings came to market over the three months against 25 a year earlier, with 10 or 11 each month.
Third, the monthly median swung with the mix of homes. It was $860,000 in August, $502,000 in September and $993,500 in October, which reflects whether condominiums or detached homes happened to close more than a change in prices.
The absorption rate stayed high all quarter, at 9.36 months in August, 9.12 in September and 8.89 in October. At the recent pace of sales, it would take roughly nine months to sell through the homes available.
What actually sold in Kimball?
Two homes closed in October: a three-bedroom detached home and a two-bedroom condominium. They sold for $1,450,000 and $537,000, and both closed below original list price.
Selected October sales
Both October sales are shown. They have not been assessed for comparability and should not be read as direct comparables for one another. They are different home types in different subdivisions.

1046 Station Loop Road, Blackhawk Station
3 bedrooms 3 bathrooms 1,942 square feet
Approximately 0.10 acres · Built 2000
Original list price: $1,500,000
Percent of original list price: 96.7%
Sale price per square foot: $747
Days on market: 24

900 Bitner Road Unit P-20, Canyon Creek
2 bedrooms 2 bathrooms 1,153 square feet
Condominium · Built 1997
Original list price: $599,000
Percent of original list price: 89.6%
Sale price per square foot: $466
Days on market: 113
1046 Station Loop Road in Blackhawk Station, built in 2000, was listed at $1,500,000 and closed at $1,450,000, 96.7 percent of its original price, after 24 days. The lot is about 0.10 acres.
900 Bitner Road Unit P-20 at Canyon Creek was listed at $599,000, reduced to $579,000, and closed at $537,000, 89.6 percent of its original price, after 113 days.
The price per square foot was $747 for the detached home and $466 for the condominium, which reflects differences in home type, age and location rather than a market-wide rate.
What did buyers have to choose from?
Ten new listings came to market in Kimball in October, up 66.7 percent from six in October 2025. Only one home went under contract, down 85.7 percent from seven.
| Activity | Aug 2026 | Sep 2026 | Oct 2026 | Oct 2025 |
|---|---|---|---|---|
| New listings | 11 | 10 | 10 | 6 |
| Pending listings | 6 | 2 | 1 | 7 |
| Closed sales | 7 | 6 | 2 | 6 |
Most of the new listings were priced below $900,000. Eight of the ten were, including one at $300,000 to $399,999 and three at $500,000 to $599,999, and two were between $1,500,000 and $1,999,999. The median list price of the new listings was $679,500.
The one home that went under contract was in the $1,000,000 to $1,499,999 range, with a list price of $1,145,000.
In mid-October, 40 homes were available, against 36 a year earlier. The increase was between $500,000 and $699,999, where there were 17 homes against 10. Homes under $500,000 were unchanged at 10, and homes at $700,000 or more slipped to 13 from 16. The median list price of available homes was $595,000, down 2.1 percent from $607,500. This is a mid-month snapshot rather than a month-end count.
The absorption rate rose to 8.89 months from 7.08 a year earlier. In plain terms, at October’s pace of sales it would take noticeably longer to sell through the available homes than it did a year ago.
For the year to date, 88 homes have been listed against 92 through the same point in 2025, 35 have gone under contract against 50, and 38 have closed against 47, a decline of 19.1 percent.
New Construction in Focus
No new-construction homes closed in Kimball in October. Both closings were established homes built in 1997 and 2000.
Current new-construction availability
As of the most recent listing search, none of the 39 active Kimball listings is flagged as new construction. The homes now on the market are established properties: 29 condominiums, five townhomes and five detached homes.
For buyers looking specifically for a newly built home in Kimball, there is currently nothing on the market to choose from, and any future supply would be a new listing worth watching for. These are current availability figures, not a month-end inventory count for October.
What does this mean for buyers and sellers?
For buyers
Buyers have room and time. There were 40 homes available in mid-October against 36 a year earlier, and at October’s pace of sales it would take about 8.9 months to sell through them. With only one home under contract, competition for most listings is light.
There is also room to negotiate. Both closed sales sold below original list price, and 15 of the 39 homes currently listed have already reduced their asking price. The condominium at 900 Bitner Road took 113 days and closed at 89.6 percent of its original price.
The added choice is concentrated between $500,000 and $699,999, with 17 homes listed in mid-October against 10 a year earlier. If you shop in that range, you can compare more options than last year.
Homes that are priced well can still sell. 1046 Station Loop Road closed in 24 days at 96.7 percent of its original price.
For sellers
Competition is the main challenge. Ten new listings came to market in October, 40 homes were available in mid-October, and only one home went under contract.
Pricing and patience mattered. 900 Bitner Road Unit P-20 was listed at $599,000, reduced to $579,000, and closed at $537,000 after 113 days. The median home currently listed has been on the market 70 days.
Condominiums dominate the supply. Twenty-nine of the 39 current listings are condominiums, so a condominium seller is competing with many similar homes and may need to stand out on price, condition or building.
One caution on the headline numbers. The October median of $993,500 is the midpoint of two very different sales, a $1,450,000 detached home and a $537,000 condominium, and it should not be used to price a particular property.
Keep the price increase in perspective
Kimball’s prices point down rather than up in October, but the same caution about medians applies in either direction. The median sale price fell 10.9 percent year over year, from $1,115,000 to $993,500. Year to date, the median is $789,000 against $760,000 for the same period of 2025, an increase of 3.8 percent.
Those two figures point in opposite directions, which is the point. October’s decline does not mean the value of every Kimball home fell by that much, and the year-to-date gain does not mean every home rose.
A median describes the middle of what sold, not the change in value of any particular property. October’s comparison is between two sales and six, and with two sales the median is simply the midpoint of a detached home and a condominium. Last October’s median was also high, 17.4 percent above the $950,000 of October 2024.
The average sale price fell 8.2 percent in October, from $1,082,500 to $993,500, and year to date it is down 3.4 percent, from $846,054 to $816,961.
Asking prices were little changed. The median list price of homes available in mid-October was 2.1 percent lower than a year earlier, and the average list price was 2.2 percent lower. Fifteen of the 39 homes currently listed have reduced their price.
What an individual owner’s home is worth depends on its subdivision, size, age, condition, views and location. The only reliable way to know is a valuation of that specific property.
What should we watch next month?
These are indicators worth following, not forecasts.
Whether buyers return.
Kimball had six homes go under contract in August, two in September and one in October, against five, five and seven in the same months of 2025. Pending activity leads closings by roughly one to two months, so the coming months will show whether sales pick up from October’s two.
Whether supply keeps building.
Sellers have listed 10 or 11 homes in each of the last three months, and 40 homes were available in mid-October against 36 a year earlier. If listings stay at that pace while sales are slow, buyers will have even more choice.
Whether more sellers cut prices.
Fifteen of the 39 homes now listed have already reduced their price, and the median home currently listed has been on the market 70 days. More reductions would suggest sellers are adjusting to the slower pace.
Frequently Asked Questions
What was the median home price in Kimball in October 2026?
The median sale price was $993,500 across two closed sales, down 10.9 percent from $1,115,000 in October 2025. With two sales it is simply the midpoint of a $1,450,000 detached home and a $537,000 condominium.
How many homes sold in Kimball in October 2026?
Two homes closed, down from six in October 2025. Combined closed volume was $2.0 million, compared with $6.5 million a year earlier.
Did homes in Kimball sell above asking price?
No. Both October closings sold below their original list price, at 96.7 and 89.6 percent of it, and they averaged 93.2 percent, compared with 89.7 percent in October 2025.
How long did homes take to sell in Kimball?
The two October closings had been listed for 24 and 113 days, an average of about 69 days, compared with an average of 124 days in October 2025. Year to date, the median is 51 days against 56 last year.
Is there any new construction for sale in Kimball?
No. None of the 39 current listings is flagged as new construction, and no new-construction home closed in October.
Why did the median price fall 10.9 percent when the year-to-date median is up 3.8 percent?
October’s median compares two sales with six, and last October’s median was unusually high. The year-to-date figure covers more sales, so it is a steadier guide to where prices stand.
How many homes are for sale in Kimball right now?
A current search shows 39 homes listed, with asking prices from $300,000 to $1,698,000 and a median of $595,000. Twenty-nine are condominiums, five are townhomes and five are detached homes, and 15 have reduced their price. This is a current figure and differs from the mid-October count of 40.
Is now a good time to buy or sell in Kimball?
That depends on your property and your timeline rather than on a single month’s numbers. October showed more choice and slower buying, but with only two sales one month cannot set a trend. A conversation about your specific home or target building will be more useful than a market average.
Thinking about buying or selling in Kimball?
Every home in Kimball is different, and a monthly median cannot tell you what your property is worth or what you should offer on a particular listing. Karen Stone works in these neighborhoods every week and can walk you through what the numbers mean for your situation. Contact Karen to talk through your plans.