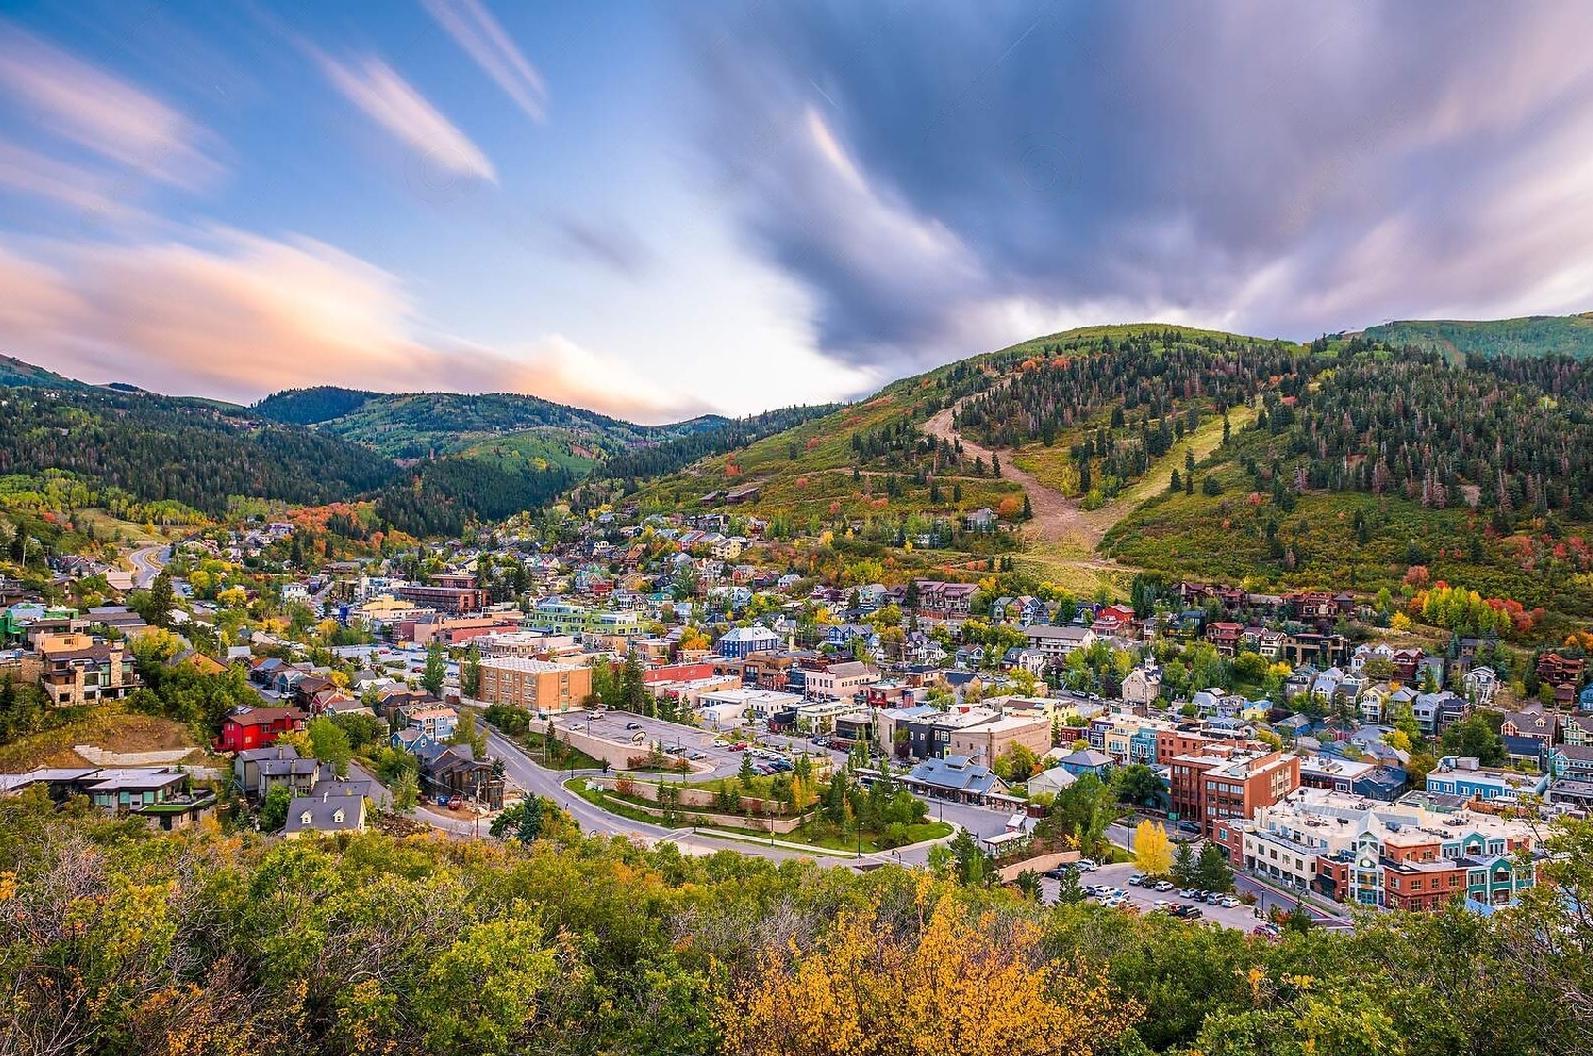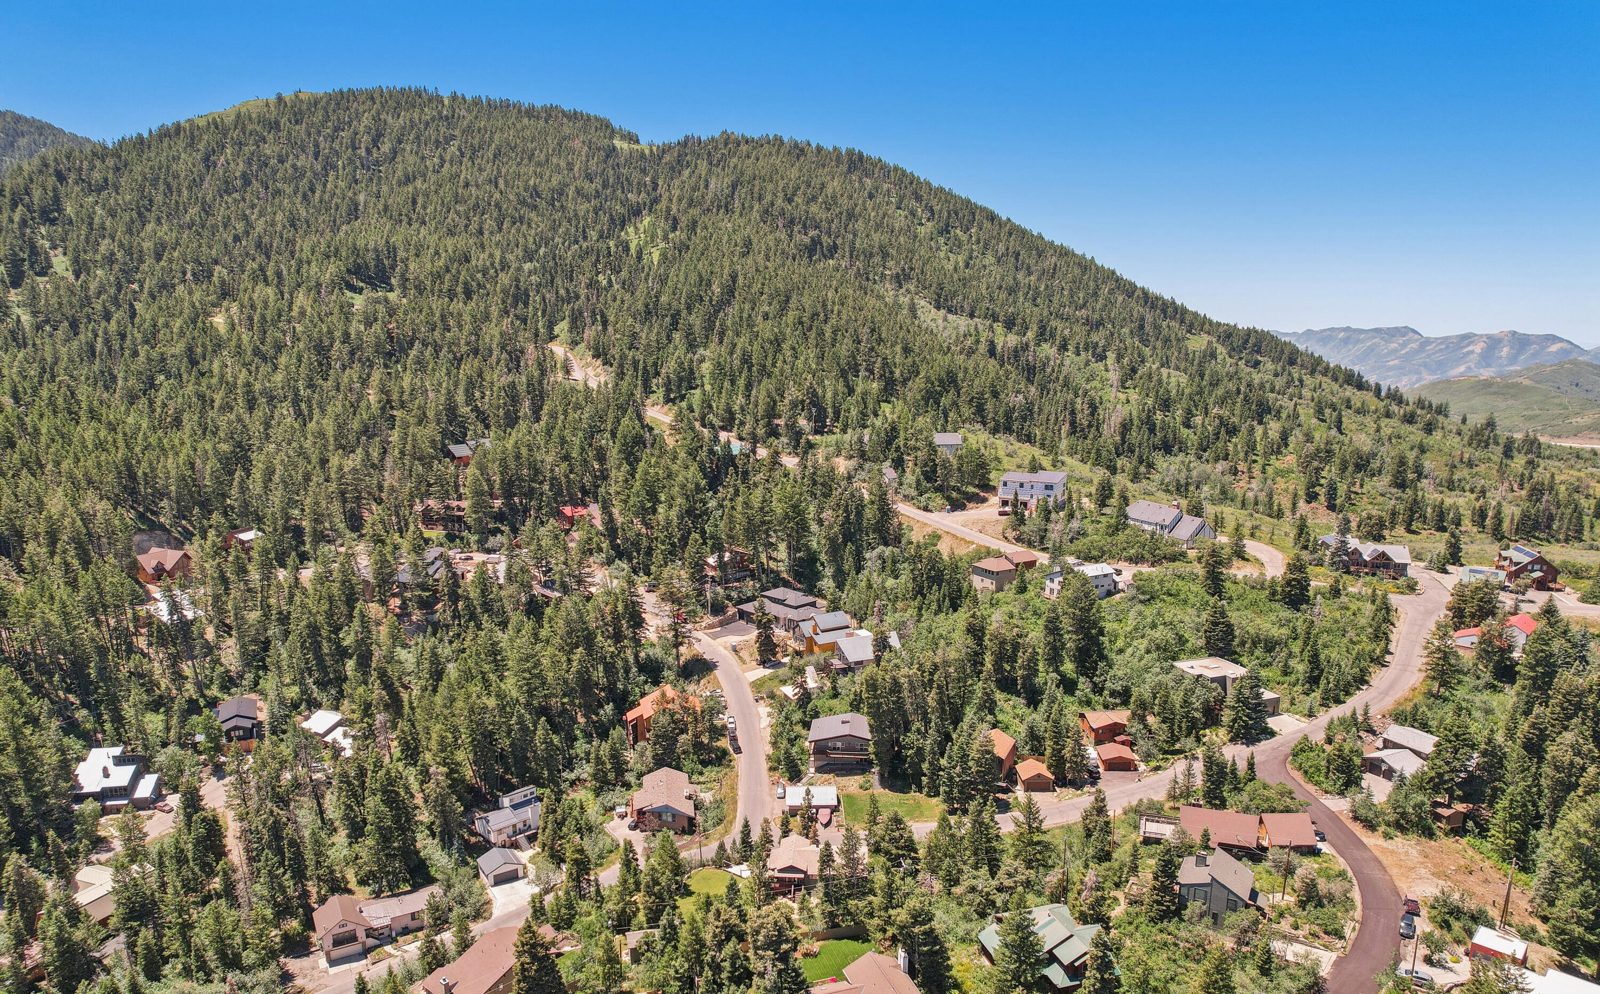
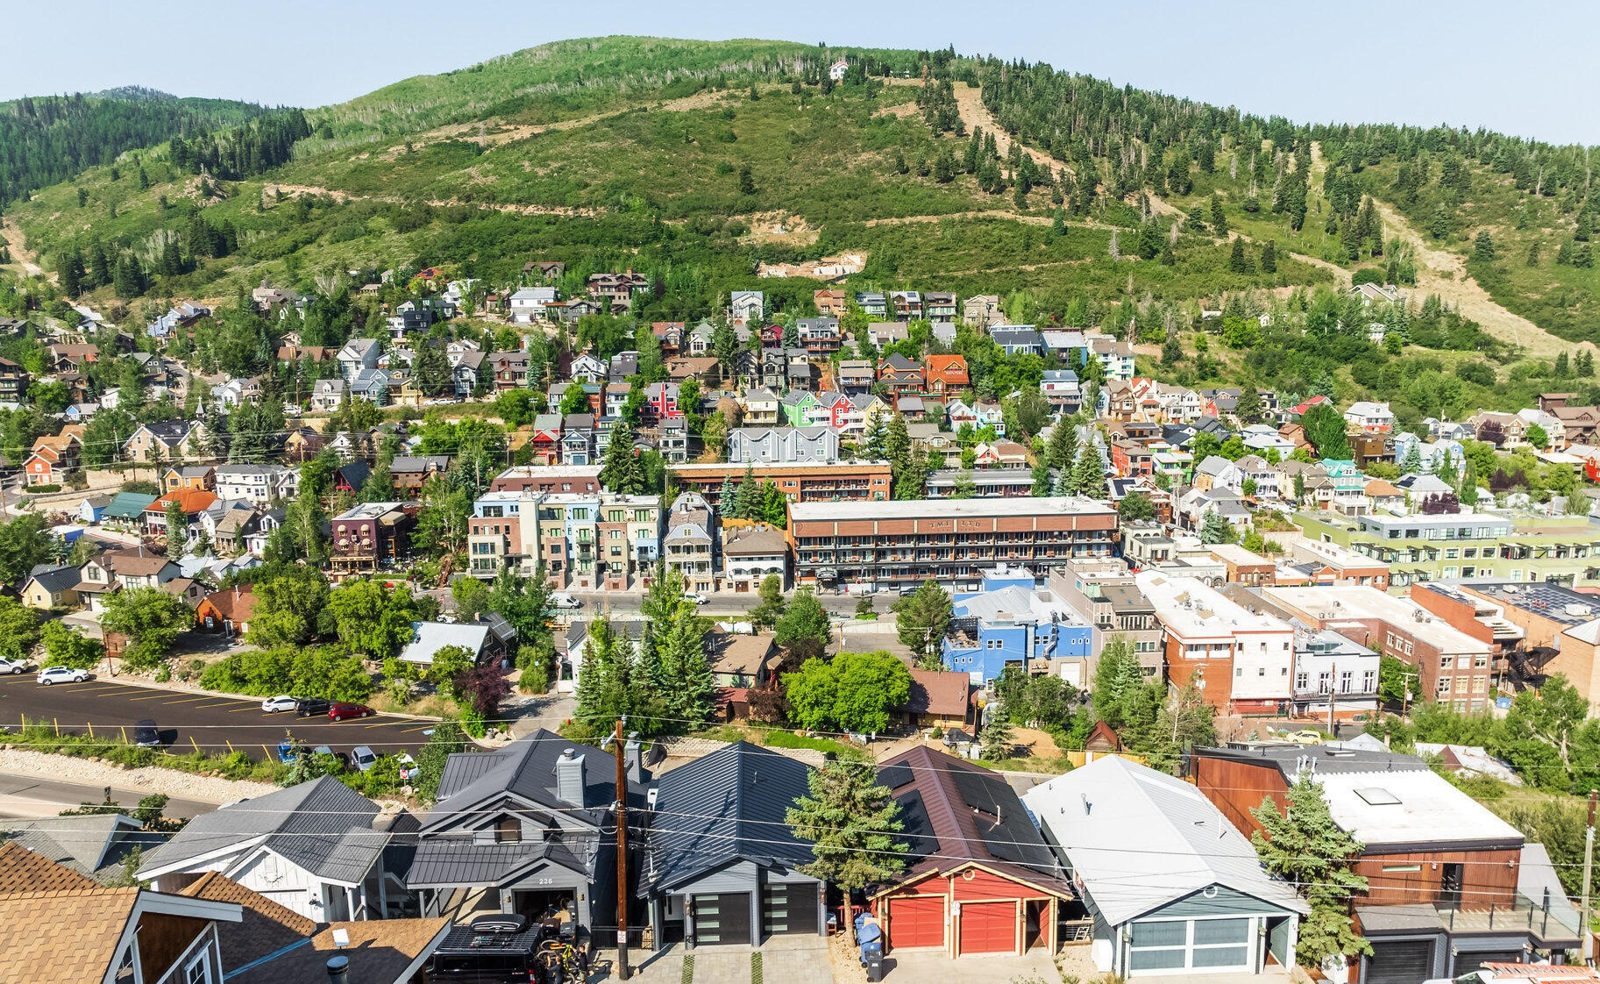
Eleven homes closed in Old Town in October at a median of $1,800,000, with buyers paying the biggest discount to original list price so far this year.
What happened in Old Town this October?
Eleven homes closed in Old Town during October 2026, one fewer than the twelve of October 2025. Total closed volume was $25.4 million, down 11.0 percent from $28.6 million.
The median sale price was $1,800,000, down 23.3 percent from $2,347,500 a year earlier. The average sale price was $2,312,000, down 3.0 percent from $2,382,362. The median fell much further than the average because last October’s median was unusually high, not because prices dropped across the board.
Seven of the eleven sales were between $1,000,000 and $2,000,000. Three were above $3 million, including a $6,650,000 home on Woodside Avenue, and one was a $757,000 condominium.
Buyers had room to negotiate. The eleven homes closed at an average of 90.0 percent of their original list price, compared with 94.5 percent a year earlier. That is the lowest monthly figure so far in 2026.
Supply also grew. Twenty-one new listings came to market, up from fourteen, while only eleven homes went under contract, down from eighteen.
Ratio
CDOM is cumulative days on market, which counts the full time a property has been listed across listing periods rather than the days until it went under contract. Average CDOM fell while median CDOM rose. Last October’s average of 132 days was far above its median of 33 days, which points to a few long-listed homes pulling that average up.
Absorption rate estimates how many months it would take to sell the listed supply at the current pace of sales. It is based on the mid-month supply count and is sensitive to small changes in sales.
How did the Old Town market change over the last three months?
Old Town closed far fewer homes than a year ago across the quarter, with 23 closings against 46 in the same three months of 2025. October’s 11 closings were the best of the three months, but still well short of last year’s pace.
August 2026
September 2026
October 2026
| Metric | Aug 2026 | Sep 2026 | Oct 2026 |
|---|---|---|---|
| Closed sales | 7 | 5 | 11 |
| Median sale price | $1,319,000 | $1,375,000 | $1,800,000 |
| Average sale price | $1,254,283 | $1,881,000 | $2,312,000 |
| Closed sale volume | $7,525,699 | $9,405,000 | $25,432,000 |
| New listings | 21 | 15 | 21 |
| Pending listings | 6 | 11 | 11 |
| Sale-to-original-list-price ratio | 94.3% | 92.9% | 90.0% |
| Average CDOM | 45 days | 64 days | 93 days |
August’s price figures reflect six of the seven closings.
The same three months a year earlier:
| Metric | Aug 2025 | Sep 2025 | Oct 2025 |
|---|---|---|---|
| Closed sales | 22 | 12 | 12 |
| Median sale price | $1,935,000 | $2,385,000 | $2,347,500 |
| New listings | 20 | 15 | 14 |
| Pending listings | 15 | 10 | 18 |
Three patterns stand out. First, sales volume rebuilt through the quarter. Closed volume rose from $7.5 million in August to $9.4 million in September and $25.4 million in October, as higher-priced sales returned to the mix.
Second, buyers paid a growing discount to original asking prices. The sale-to-original-list-price ratio slipped from 94.3 percent in August to 92.9 percent in September and 90.0 percent in October.
Third, homes took longer to sell. Average CDOM climbed from 45 days in August to 64 days in September and 93 days in October.
Seller activity held up while buyer activity did not. Over the three months, 57 homes were listed against 49 a year earlier, but only 28 went under contract against 43.
What actually sold in Old Town?
Eleven homes closed in October: five townhomes, two single-family detached homes, two condominiums, one attached home and one multi-unit building. Prices ranged from $757,000 to $6,650,000.
Only one home, 720 Deer Valley Drive Unit 2 in Foxglove Cottages, closed at its full asking price. The other ten closed below their original list price, several by a wide margin.
The median sale was $1,800,000 and the average $2,312,000. The three sales above $3 million, which together made up more than half of the month’s closed volume, are what lift the average above the median.
Selected October sales
These three sales illustrate the range of home types, sizes and prices that traded in October. They have not been assessed for comparability and should not be read as direct comparables for one another.

901 Woodside Avenue, Snyders Addition
4 bedrooms 5 bathrooms 3,107 square feet
Approximately 0.04 acres
Original list price: $7,000,000
Percent of original list price: 95.0%
Sale price per square foot: $2,140
Days on market: 42

328 Woodside Avenue, Old Town Area
3 bedrooms 4 bathrooms 2,111 square feet
Approximately 0.07 acres · Built 2023
Original list price: $4,380,000
Percent of original list price: 99.3%
Sale price per square foot: $2,061
Days on market: 33

420 Marsac Avenue, Old Town Area
6 bedrooms 4 bathrooms 3,365 square feet
Approximately 0.09 acres · Built 1973
Original list price: $3,950,000
Percent of original list price: 87.7%
Sale price per square foot: $1,030
Days on market: 0
901 Woodside Avenue was the month’s largest sale. It was listed at $7,000,000 and closed at $6,650,000, 95.0 percent of its original price, after 42 days.
328 Woodside Avenue, a 2023 home on a 0.07-acre lot, closed at $4,350,000, within one percent of its asking price.
17 Daly Avenue shows how far some sellers moved. It started at $2,750,000, was reduced to $2,100,000, and closed at $1,810,000, 65.8 percent of its original price, after 100 days.
1713 Captain Molly Drive in Park Avenue Condominiums sold for exactly the month’s median price of $1,800,000, at 79.1 percent of its original list price.
At the lower end, a one-bedroom condominium at Treasure Mountain Inn on Main Street sold for $757,000, close to its $769,000 asking price.
Price per square foot ranged widely across these three, from $1,030 to $2,140, which reflects differences in home type, age, size and lot rather than a market-wide rate.
What did buyers have to choose from?
Twenty-one new listings came to market in Old Town in October, up 50.0 percent from fourteen in October 2025. Only eleven homes went under contract, down 38.9 percent from eighteen.
| Activity | Aug 2026 | Sep 2026 | Oct 2026 | Oct 2025 |
|---|---|---|---|---|
| New listings | 21 | 15 | 21 | 14 |
| Pending listings | 6 | 11 | 11 | 18 |
| Closed sales | 7 | 5 | 11 | 12 |
The new listings were spread across the market. Eleven of the 21 were priced at $2,000,000 or more, five were between $1,000,000 and $1,999,999, and five came to market below $1,000,000.
The homes that went under contract skewed lower. Six of the eleven were priced between $1,000,000 and $1,999,999, and the median list price of homes going under contract was $1,350,000.
In mid-October, 106 homes were available, against 79 a year earlier. Their median list price was $2,437,500, up 21.9 percent from $1,999,000, and the average list price rose 6.2 percent to $3,200,099. This is a mid-month snapshot rather than a month-end count.
The absorption rate rose to 11.26 months from 7.41 a year earlier. In plain terms, at October’s pace of sales it would take considerably longer to sell through the available homes than it did a year ago.
For the year to date, 201 homes have been listed in Old Town, almost the same as the 202 of 2025. But closings are down 26.7 percent, at 77 against 105, and pending listings are down 27.8 percent, at 83 against 115. Sellers are bringing the same number of homes to market while fewer buyers are completing purchases.
New Construction in Focus
Two of October’s eleven closings were new-construction homes, and both were on Woodside Avenue. Together they totaled $11,000,000, roughly 43 percent of the month’s closed volume.
October new-construction closings
| Measure | Value |
|---|---|
| New-construction closings | 2 of 11 |
| 901 Woodside Avenue | $6,650,000 |
| 328 Woodside Avenue | $4,350,000 |
| Combined sale price | $11,000,000 |
| Construction stage | Both complete |
Both closed close to their asking prices, at 95.0 percent and 99.3 percent of original list. They were among the three highest-priced sales of the month, which is part of why the average sale price sits well above the median.
Current new-construction availability
As of the most recent listing search, 3 of the 102 active Old Town listings are explicitly flagged as new construction. All three are single-family homes.
| Measure | Value |
|---|---|
| Asking price range | $2,799,000 – $12,900,000 |
| Median asking price | $5,500,000 |
The two completed homes are on 15th Street and Daly Avenue and can be bought now. The home under construction, on Main Street, lists a June 2027 completion date.
The median asking price across all 102 current listings is $2,462,500, so new construction sits at the upper end of what is for sale. These are current availability figures, not a month-end inventory count for October.
What does this mean for buyers and sellers?
For buyers
Buyers have leverage in Old Town right now. The eleven October closings averaged 90.0 percent of their original list price, and only one home sold at its full asking price. Forty-four of the 102 homes currently listed have already reduced their price.
Choice is wide. In mid-October, 106 homes were available against 79 a year earlier, and a current search shows asking prices running from $479,000 to $20,000,000.
The size of the discount varied a great deal, so it pays to look at each home individually. 17 Daly Avenue closed at 65.8 percent of its original price, while 328 Woodside Avenue closed at 99.3 percent and 720 Deer Valley Drive Unit 2 sold at full price in 30 days. Homes that were priced realistically from the start still moved.
Time is also on the buyer’s side. The median home that closed in October had been listed for 91 days, and with fewer homes going under contract, there is less competition for most listings.
For sellers
Pricing is the deciding factor. Sellers who started high often had to come down. 17 Daly Avenue went from $2,750,000 to $2,100,000 before closing at $1,810,000, and 1713 Captain Molly Drive closed at 79.1 percent of its original list price.
There is also a gap between where homes are listed and where buyers are contracting. New listings in October had a median list price of $2,100,000, while the homes that went under contract had a median list price of $1,350,000.
Competition is heavy. Forty-four of the 102 current listings have cut their price, the absorption rate is 11.26 months against 7.41 a year ago, and year-to-date closings are down 26.7 percent.
One caution on the headline numbers. The October median sale price of $1,800,000 is the middle of eleven very different sales, from a $757,000 condominium to a $6,650,000 home, and it should not be used to price a particular property.
Keep the price increase in perspective
Old Town’s price comparisons point down rather than up this month, but the same caution about medians applies in either direction. The median sale price fell 23.3 percent year over year in October, from $2,347,500 to $1,800,000. Year to date, the median is $1,690,000 against $1,847,245 for the same period of 2025, a decline of 8.5 percent.
Those are real figures, but they do not mean the value of every Old Town home fell by those amounts.
A median describes the middle of what sold, not the change in value of any particular property. Last October’s median was unusually high, 72.6 percent above the $1,360,000 of October 2024, which makes this October’s decline look larger. October’s comparison is also between eleven sales and twelve, and the median moves whenever the mix of homes changes.
The average sale price tells a milder story. It slipped 3.0 percent in October, from $2,382,362 to $2,312,000, and year to date it is down 8.6 percent, from $2,410,267 to $2,204,071.
Within Old Town, outcomes varied widely. 328 Woodside Avenue closed at 99.3 percent of its original list price and 17 Daly Avenue closed at 65.8 percent. The median also rose across the recent quarter, from $1,319,000 in August to $1,375,000 in September and $1,800,000 in October, as more higher-priced homes closed.
Asking prices moved the other way. The median list price of homes available in mid-October was 21.9 percent higher than a year earlier, yet 44 of the 102 homes currently listed have reduced their price.
What an individual owner’s home is worth depends on its building or subdivision, size, age, condition, views and location. The only reliable way to know is a valuation of that specific property.
What should we watch next month?
These are indicators worth following, not forecasts.
Whether the discount to original list price keeps widening.
The sale-to-original-list-price ratio has slipped from 94.3 percent in August to 92.9 percent in September and 90.0 percent in October, the lowest monthly figure of 2026 so far, and 44 of the 102 homes now listed have cut their price. Another month of data will show whether this is a trend or a few sales.
Whether pending activity recovers.
Eleven Old Town homes went under contract in October, against eighteen a year earlier, and 28 over the last three months against 43. Pending activity leads closings by roughly one to two months, so November’s figure will say a good deal about the closings to come.
Whether supply keeps outpacing sales.
Twenty-one homes were listed in October against eleven that closed, and the absorption rate stands at 11.26 months. If listings slow or sales pick up, that gap could narrow.
Frequently Asked Questions
What was the median home price in Old Town in October 2026?
The median sale price was $1,800,000 across eleven closed sales, down 23.3 percent from $2,347,500 in October 2025. Last October’s median was unusually high, which exaggerates the decline.
How many homes sold in Old Town in October 2026?
Eleven homes closed, down from twelve in October 2025. Combined closed volume was $25.4 million, compared with $28.6 million a year earlier.
Did homes in Old Town sell above asking price?
No. The eleven October closings averaged 90.0 percent of their original list price, compared with 94.5 percent in October 2025. Only one home, 720 Deer Valley Drive Unit 2, closed at its full asking price, and none closed above it.
How long did homes take to sell in Old Town?
The median cumulative days on market for October closings was 91 days, and the average was 93 days. Year to date, the median is 54 days against 28 last year, so homes are taking noticeably longer to sell.
Is there any new construction for sale in Old Town?
Yes. Three of the 102 current listings are flagged as new construction, all single-family homes. Two are complete and one is under construction, with asking prices from $2,799,000 to $12,900,000. Two new-construction homes on Woodside Avenue closed in October.
Why did the median price fall more than the average price?
The median fell 23.3 percent while the average fell 3.0 percent, which usually points to a change in the mix of homes sold. October 2025’s median was also unusually high, 72.6 percent above October 2024, so the comparison starts from a high base.
How many homes are for sale in Old Town right now?
A current search shows 102 homes listed, with asking prices from $479,000 to $20,000,000 and a median of $2,462,500. Sixty-six are condominiums or townhomes, 35 are detached homes and one is a multi-unit building, and 44 have reduced their price. This is a current figure and differs from the mid-October count of 106.
Is now a good time to buy or sell in Old Town?
That depends on your property and your timeline rather than on a single month’s numbers. October showed more choice and more negotiating room for buyers, and a tougher pricing environment for sellers. A conversation about your specific home or target neighborhood will be more useful than a market average.
Thinking about buying or selling in Old Town?
Every home in Old Town is different, and a monthly median cannot tell you what your property is worth or what you should offer on a particular listing. Karen Stone works in these neighborhoods every week and can walk you through what the numbers mean for your situation. Contact Karen to talk through your plans.